Cluster Dashboard
The Cluster page displays a comprehensive list of clusters associated with the respective tenant. It provides detailed insights into each cluster, including their status and YCU consumption. One table carries all of it: the status, which runs from INITIATING through to ERROR, the cloud provider, the runtime version, the machine type, the memory and cores currently attached, the cumulative Total YCU, and the attached metastore where there is one. From that same row you can stop or start a cluster, destroy it, archive it, or clone its configuration into a new one.
Users can access Clusters by selecting the Clusters option in the Yeedu navigation panel.
Clusters landing page
Clusters are a tenant-level resource, reached from Clusters in the left navigation panel, not from inside a workspace.
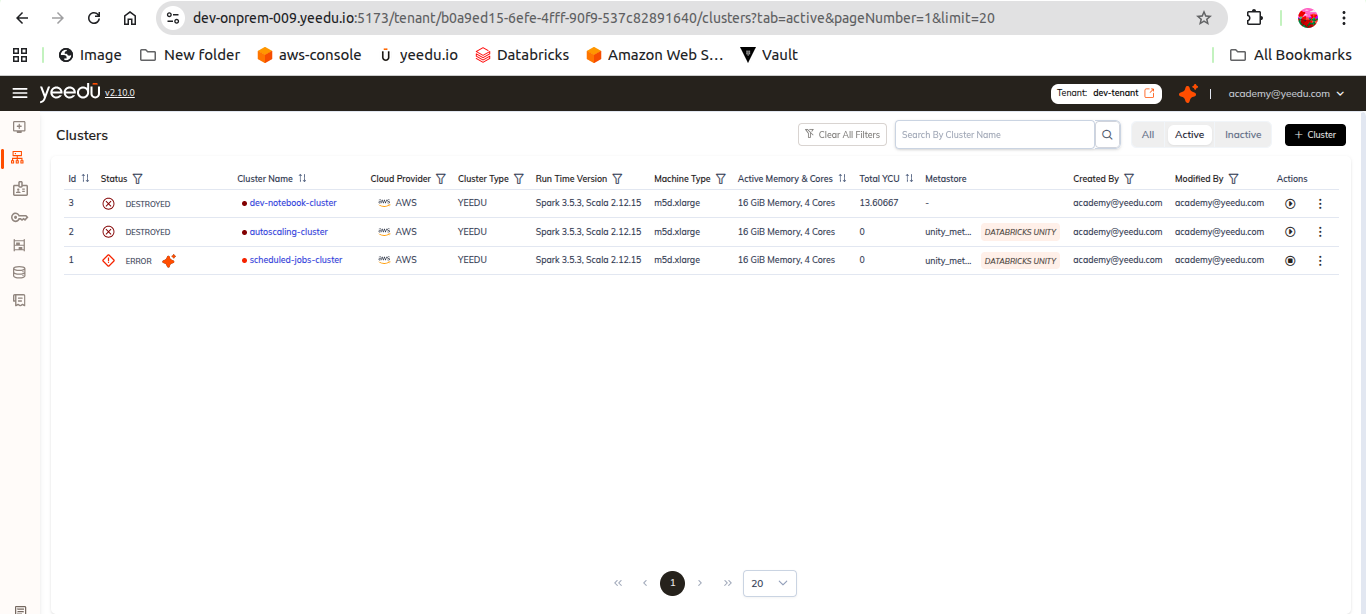
Filter pills
| Pill | Shows |
|---|---|
All | Every cluster in the tenant. |
Active | Clusters that haven't been archived. This is the default. |
Inactive | Clusters archived from the row menu. |
Columns
| Column | Detail |
|---|---|
ID | The cluster's unique numeric identifier. Sortable. |
Status | INITIATING, RUNNING, STOPPING, STOPPED, DESTROYING, DESTROYED or ERROR. Filterable. |
Cluster Name | The cluster name with a live status dot. Sortable. |
Cloud Provider | OCI, OnPrem, GCP, AWS or Azure, each with its provider glyph. Filterable. |
Cluster Type | YEEDU, STANDALONE or CLUSTER. Filterable. |
Run Time Version | The Spark and Scala versions, for example Spark 3.5.3, Scala 2.12.15. Filterable. |
Machine Type | The instance shape, for example Onprem-M-8 or Standard_D4d_v5. Filterable. |
Active Memory & Cores | The compute currently attached, for example 16 Memory, 8 Cores. Sortable. |
Total YCU | Cumulative Yeedu Compute Units consumed by this cluster. Sortable. |
Metastore | The attached metastore, with a type badge such as HIVE, AWS GLUE or DATABRICKS UNITY. - where none is attached. |
Created By | The user who created the cluster. Filterable. |
Created Time | The absolute timestamp, with a relative age beneath it. |
Modified Time | The absolute timestamp, with a relative age beneath it. |
Actions | The per-row controls described below. |
We make the column set configurable. The column-picker icon in the toolbar shows and hides columns, so your view may differ from our screenshot.
Toolbar
A refresh icon, a filter icon and the column picker sit above the table, followed by the
Search By Cluster Name box, the three pills, and the + Cluster button.
Row actions
Each row ends with two controls.
| Control | Tooltip | Behaviour |
|---|---|---|
| State toggle | Stop on a running cluster, Start on one that is stopped or destroyed | Starts or stops the cluster in place. |
Kebab ⋮ | (none) | Opens the row menu below. |
The kebab menu is state-dependent:
| Cluster status | Menu entries |
|---|---|
RUNNING | Destroy · Clone |
Not running (for example DESTROYED) | Destroy · Inactive · Clone |
| Entry | Behaviour |
|---|---|
Destroy | Tears the cluster down, releasing its compute. |
Inactive / Active | Archives the cluster, or restores it. Offered only once the cluster isn't running; the entry reads Active while you're on the Inactive pill. |
Clone | Opens the create form pre-filled from this cluster's configuration. |
We don't allow a running cluster to be archived. Stop or destroy it first, and Inactive then appears in
its row menu.
Cluster detail page
Clicking a cluster name on the Clusters list opens that cluster's detail page.
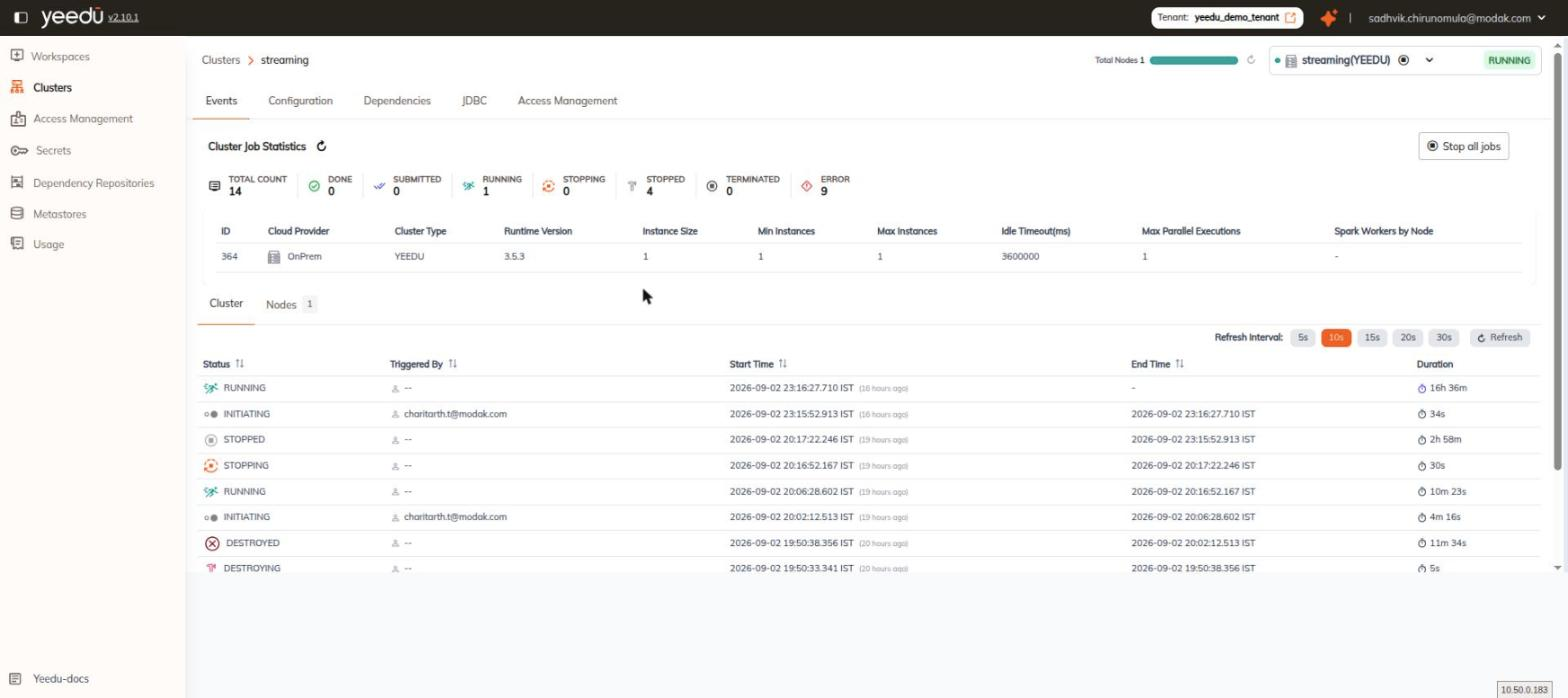
Persistent header
The header stays in place on every tab:
| Element | Description |
|---|---|
| Breadcrumb | Clusters ❯ <cluster name> |
| Total Nodes | A Total Nodes N readout with a horizontal capacity bar and a refresh icon |
| Cluster chip | Shown on the far right as <name>(<CLUSTER TYPE>) with a live status dot |
| Stop / Start | A Stop icon button on the cluster chip. On a stopped cluster this becomes Start |
| Chevron menu | The chevron next to the Stop button opens a menu containing a single item — Destroy |
| Status badge | The cluster's current status (for example RUNNING) at the far right edge |
Tab bar
The cluster detail page has exactly five tabs, in this order:
| Tab | What it contains |
|---|---|
| Events | Cluster job statistics, the cluster summary strip, and the Cluster / Nodes monitoring sub-tabs |
| Configuration | The cluster edit form plus a read-only CLUSTER DETAILS panel |
| Dependencies | The file browser for the dependency repository attached to this cluster |
| JDBC | JDBC username/token cards and one row per workspace that can attach to this cluster |
| Access Management | Which workspaces may attach to (and therefore run on) this cluster |
Each tab maps to a route under /tenant/<tid>/cluster/<clusterId>/:
| Tab | Route |
|---|---|
| Events | cluster-events-view/cluster-events |
| Configuration | cluster-configuration |
| Dependencies | dependency-management/<repoId>/dependency-files/root |
| JDBC | jdbc?page=1&limit=20 |
| Access Management | cluster-access-management |
There's no separate "Dashboard" tab and no separate "Node-Level Monitoring" tab. All cluster
and node monitoring lives under Events, split into the Cluster and Nodes sub-tabs. See
Monitoring and Node-Level Monitoring.